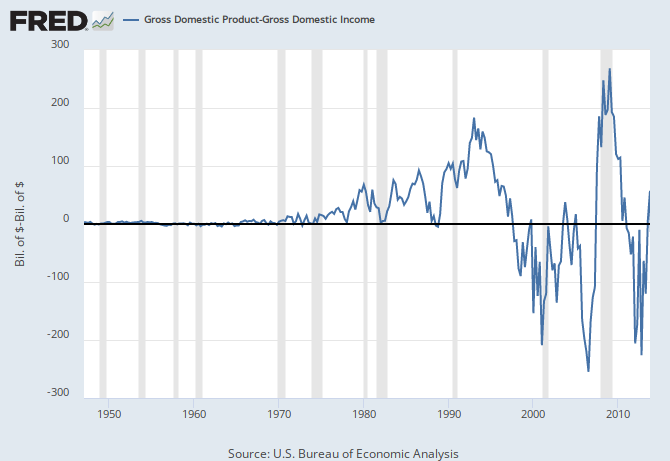
One of the things I learned during my four years of undergraduate higher education is that 1973 is where everything started to go wrong. In just about every time series of social data, that's the turning-point, where things stopped getting better or started getting worse or both. Stuff like economic inequality, incarceration rates, various aspects of race relations, etc. But I was kind of surprised to see that the same seems to be true of the relationship between Gross Domestic Product and Gross Domestic Income. The two are, by definition, identical, but we measure them separately. We would, obviously, like to see the two measures stick pretty close to one another. Here's a time series of GDP - GDI (courtesy of
Matt Yglesias):
The moment when it starts diverging from the zero line is, you guessed it, 1973. Seriously, that's when
everything went wrong. Fundamental economic identities started breaking down! Richard Nixon really did a number on the world.
I'll note that I'm less than 100% certain in this diagnosis. The chart isn't in proportional form, and obviously GDP has been growing steadily, especially nominal GDP. So it's possible that, pre-1973, it was fluctuating around zero just as much as it has seemed to be later, as a proportion of the total figure. My sense is that this isn't the case, but without having actual numbers in front of myself I can't be confident in that belief. (Very roughly I think I get that a disparity as large as the -$230 billion or so from around 2005 would've been something like $17 billion in the years before 1970, and the +$180 billion from around 1992 is a bit bigger than that, and it doesn't look like there were any divergences that big, but that's based on eyeballing squiggly lines and thus comes with massive confidence intervals.)
So I
think this is yet another extreme example of how 1973 is when everything started going bad, but I'm not completely certain.

No comments:
Post a Comment